driving Retail Performance
10.11.2026
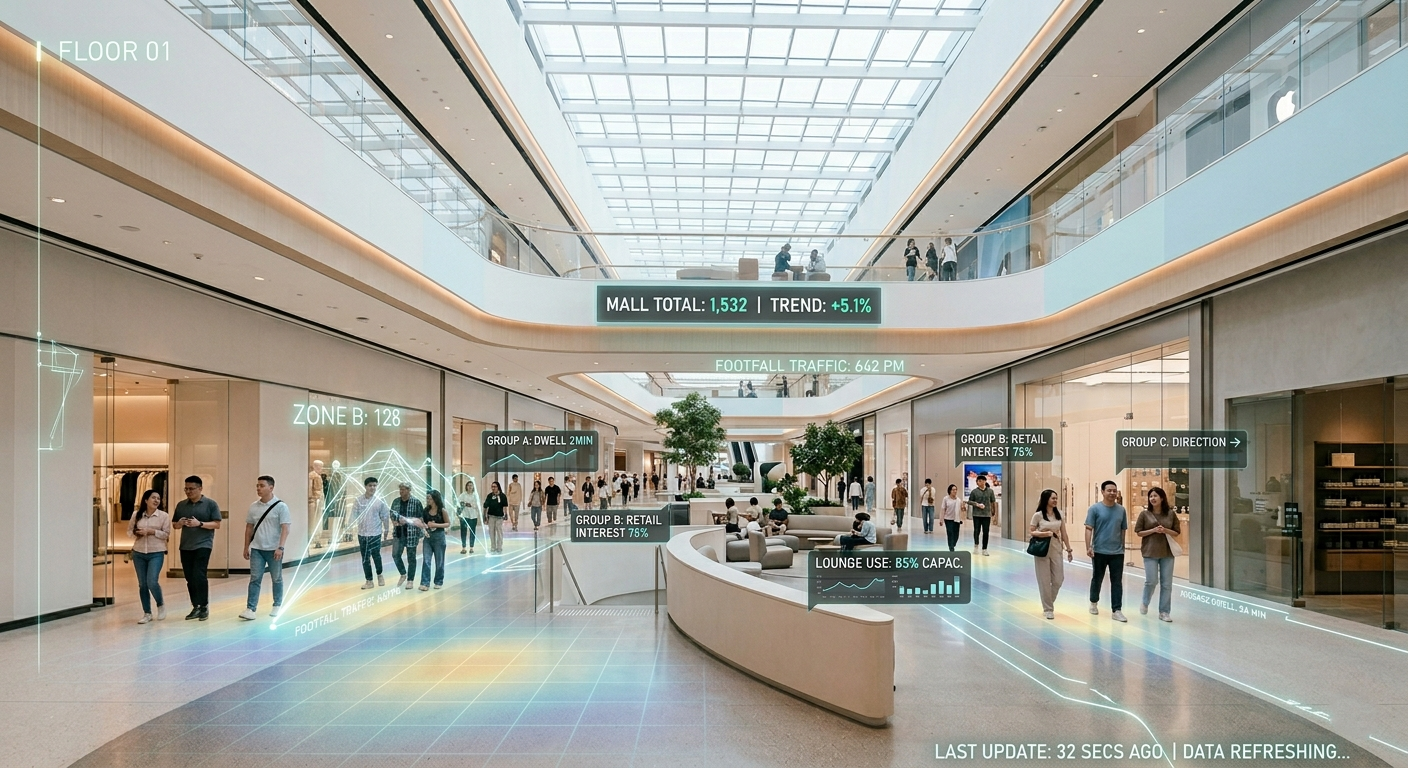
For years, the headline number for a shopping center was visitor count. It is still important, but it no longer tells the whole story. Two malls with the same footfall can perform very differently, depending on how long visitors stay, which zones they use and how the tenant mix fits their behavior. This article shows how mall teams can combine visitor counts with dwell time to make better decisions on tenant mix, events and space.
Mall operators and asset managers face a simple challenge: tenants want proof that the center brings customers, while owners want proof that the space is used well. Footfall and dwell time give both sides a shared factual basis, provided the data is measured consistently at entrances and inside the building.
Not everyone who walks through a corridor is visiting a store. Counting at entrances and at zone level helps you tell the difference between visitors who come for the mall and people who are simply passing through, for example on the way to a metro station or an office.
Entrance counts tell you how many people came to the building. Zone counts show how they distribute across floors, wings and food courts. Together they answer the question that matters most to a leasing team: how much of the total visitor flow actually reaches each tenant's area.
Be careful when comparing buildings with different structures. A mall with several entrances and a transit connection will naturally show very different patterns from a single-entrance center.
Two areas with the same traffic can behave very differently. Where visitors stay longer, food, services and seating tend to support the visit; where they hurry, the zone may need a stronger reason to stop.
Dwell time also helps you evaluate common areas. If a new seating area, play space or event stage increases the time people spend nearby, it supports the visit as a whole, even if it does not generate rent directly.
Track dwell time over weeks instead of days. Short peaks around events are useful, but the everyday pattern tells you whether the space works when nothing special is happening.
Look at which tenants sit on routes with high traffic but low dwell, and which sit in quiet corners. This gives leasing teams facts for conversations about placement and mix, instead of assumptions or the loudest voice in the room.
A tenant in a quiet corner may need a different kind of support: signage, a destination concept or a change in neighbors. A tenant on a busy route with low dwell may be well placed for convenience categories but less suited to products that need time and consideration.
When planning a new floor layout or a re-letting, use the existing movement data to test your ideas. Ask which flows you want to strengthen and which tenants can create a reason for visitors to go deeper into the building.
Compare your busiest days and hours with the event calendar. Events work best when they extend dwell time at moments that are already busy, or lift traffic in slow periods. Without data, it is easy to schedule activities at times that are already full, or to miss quiet windows that would benefit most.
After each event, compare visitor numbers and dwell time with the same weekday in earlier weeks. Look at the entrance and at the zone around the event, because the effect on neighboring tenants is often what matters most to them.
Share the results with tenants. Transparent before-and-after numbers make it easier to agree on the next event and to decide who participates and who contributes to the cost.
After a layout, signage or event change, compare the same weekday and hours with earlier weeks. Keep the comparison simple so tenants and management can both follow it. Complicated models are hard to explain and easy to challenge.
Document what changed and when. A short log of changes next to your weekly visitor numbers is often enough to explain a rise or a dip months later, when nobody remembers the details.
Take weather, holidays and school vacations into account before drawing conclusions. They move footfall on their own and can hide or exaggerate the effect of your measures.
Counting is the foundation, but decisions come from context: where people go, how long they stay and what changed. A platform that brings these views together, such as Counttrack 360, helps mall teams discuss performance with tenants using the same numbers.
The goal is not a bigger number on a dashboard. It is a building that fits how people actually use it, with a tenant mix and an event program that reflect real behavior.
If you would like to explore what this could look like for your center, our team will be happy to talk.
What is the difference between footfall and dwell time? Footfall counts how many people enter a building or zone. Dwell time measures how long they stay there. Both are needed to understand how a space is used.
Where should counters be placed in a mall? At all entrances for total visitors, and in key zones such as food courts, anchor stores and main corridors for the internal flow.
How often should mall teams review this data? Weekly for operations, monthly for tenant discussions, and at least quarterly for strategic decisions on layout and mix.