driving Retail Performance
05.11.2026
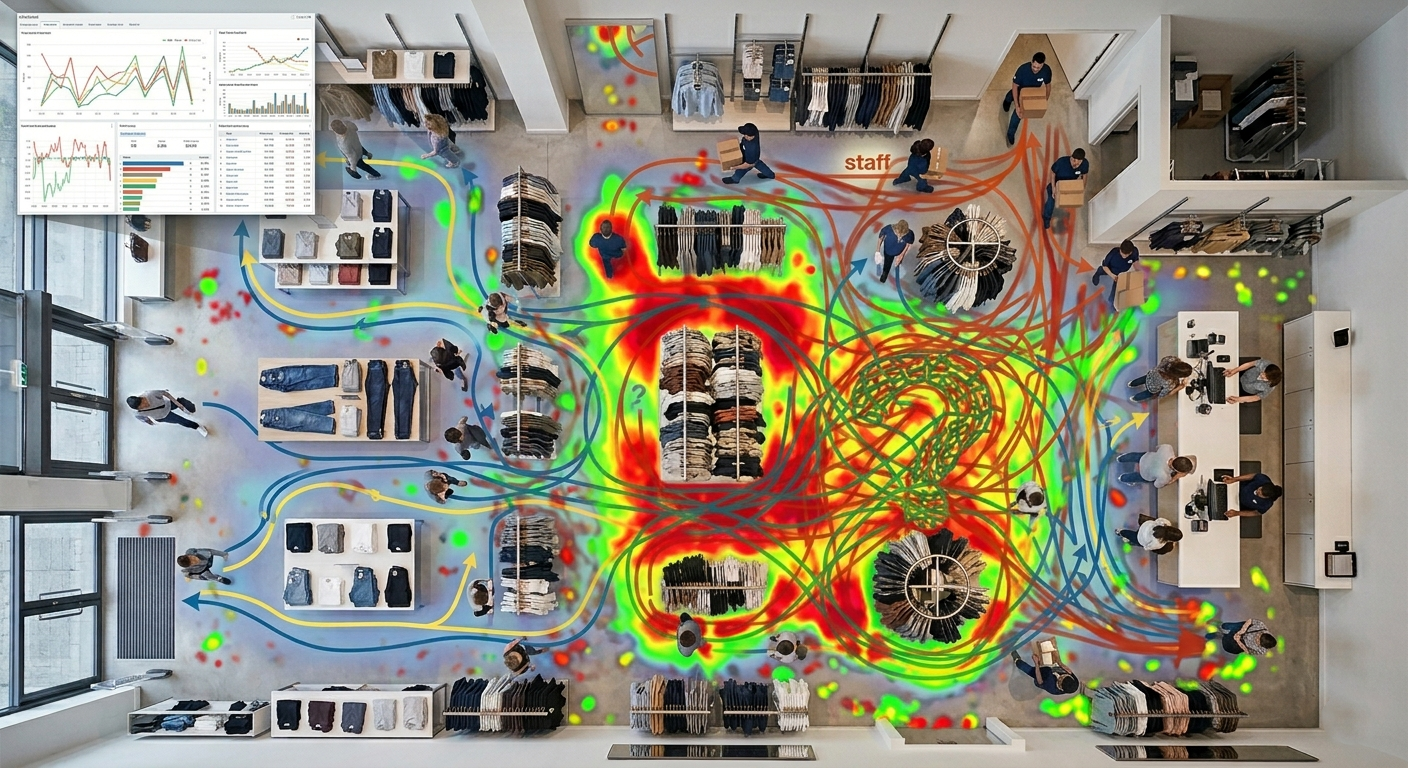
A heatmap looks impressive in a presentation: red where it is busy, blue where it is quiet. But a colorful picture is not a decision. The real question is what you will do differently on Monday morning. In this guide we walk through five practical decisions a store heatmap can support, how to read the colors correctly and the one condition that makes the data trustworthy.
A store heatmap summarizes where visitors walk and how long they stay in each area over a chosen period. Retail teams use it to adjust layout, place promotions, plan staffing and judge whether a visual merchandising change worked. It is a practical tool for store managers, visual merchandisers and regional teams alike, as long as it is read with a clear question in mind.
Start by looking for cold zones that sit directly next to hot ones. Products in these pockets are close to the customer's path but rarely noticed. They are the easiest wins, because you do not need to change the whole store, only the position of a few items.
Pick two or three categories that matter for margin or stock rotation and check where they sit on the map. If a high-priority category is in a quiet corner, swap places with a category that attracts visitors anyway. Customers keep coming for the products they want, and you gain exposure for the ones they might not have looked for.
Give the change at least two weeks before judging it, and compare the same weekdays. A single day, especially around a holiday or campaign, is not enough to know whether the new position works.
Footfall tells you where people pass; dwell time tells you where they stop. A promotion placed in a busy corridor can be ignored, while the same display at a natural pause point gets attention. Pause points are often near fitting rooms, tables with products to touch, windows facing the entrance or the end of an aisle.
Overlay your current promotion locations with the dwell-time layer of the heatmap. If a campaign display sits where people walk fast, test moving it a few meters towards an area with longer stays. If an area has long dwell but little to see, it may be a good place for new products or conversations with staff.
Remember that long dwell is not always positive. A long stay in front of a price label may be confusion rather than interest. Combine heatmap data with feedback from the sales floor to interpret what you see.
Compare where your team stands with where customers spend their time. Many stores are staffed according to a floor plan that made sense when the store opened, not according to how shoppers behave today. The heatmap shows whether help is available where customers need it.
Look at the time dimension as well. A zone that is calm in the morning but crowded after work needs a different staffing pattern than the same zone at noon. Adjust positions and breaks so that busy zones are covered when it matters.
Use the data in coaching conversations with the team. Showing staff the actual customer flow is more convincing than general guidelines, and it helps them understand why a change of position is being suggested.
A very hot spot is not always good news. Crowding right behind the door, or a dense cluster near the cash desk, often signals a narrow passage or a display that blocks the flow. Customers who have to squeeze past each other tend to move on quickly.
Check the entrance zone first. The first meters of a store set the tone for the visit; a clear, open entrance lets visitors orient themselves and move deeper into the space. If the heatmap shows that people stack up at the door, consider moving tables, stands or promotional material back.
At the checkout, look at where the line forms and where it blocks the walkway. Small layout changes here often make the visit smoother for everyone, including customers who are only passing through.
To know whether a change worked, compare the same weekday and the same hours before and after. Keep an eye on campaigns, weather and holidays, because they move traffic on their own. One change per test keeps the result readable.
Write down what you changed, when you changed it and what you expected to see. Review the heatmap after the test period and ask three questions: did traffic in the target zone increase, did dwell time change, and did the neighboring zones lose visitors? That keeps the analysis honest and repeatable.
Over several months this habit builds a small library of experiments for your stores. New managers can learn from earlier tests instead of repeating them.
If staff movement is part of the map, counters and stock rooms look like hotspots and every decision above is built on noise. Employees spend the whole day in the store and walk the same routes again and again, so they can dominate a heatmap that mixes everyone together.
Automatic staff exclusion solves this by separating employees from customers before the map is drawn, so the heatmap describes shoppers only. This also improves conversion calculations and dwell time, because staff visits no longer inflate visitor numbers.
If you would like to see what your own stores would show, talk to our team about a Counttrack 360 demo.
What is a store heatmap? A store heatmap is a visual summary of where visitors walk and how long they stay in different areas of a store over a period of time. Warm colors usually show high traffic or long dwell time; cool colors show low activity.
How long should I collect data before making changes? Ideally several full weeks, so that weekday patterns, paydays and campaigns are visible. A single day can be misleading.
Can a heatmap replace store visits? No. It shows what happens, not why. The best results come from combining the map with observation and conversations with staff and customers.